ONE-CLICK CASHFLOW Analysis TOOLKIT

5 Free Property Valuation & Equity Tools Online

Discover trusted tools to estimate market value and usable equity.
Explore Free Valuation Tools

5 Free Property Valuation & Equity Tools Online

Knowing your property’s current value and available equity is essential whether you're refinancing, investing, or simply tracking capital growth. Fortunately, several Australian banks and property data providers offer free online tools to estimate your property's worth using CoreLogic and other valuation engines.

Below are 5 of the most reliable and easy-to-use platforms for checking your property value and equity—completely free. Curated by PropMax.com.au.


Table of Contents


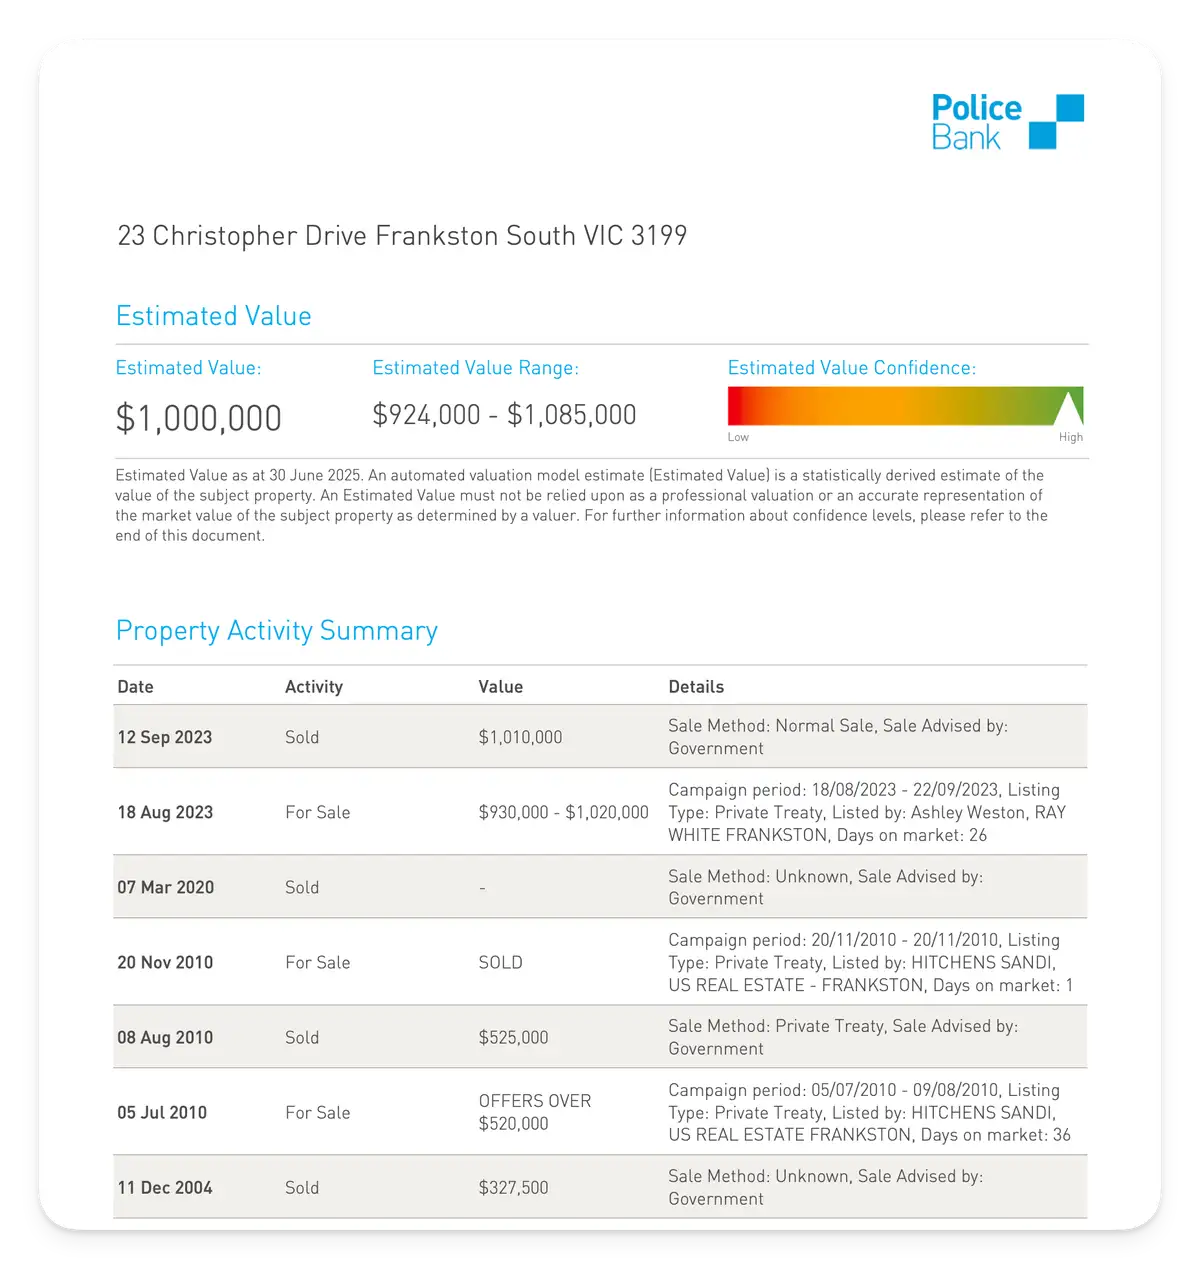
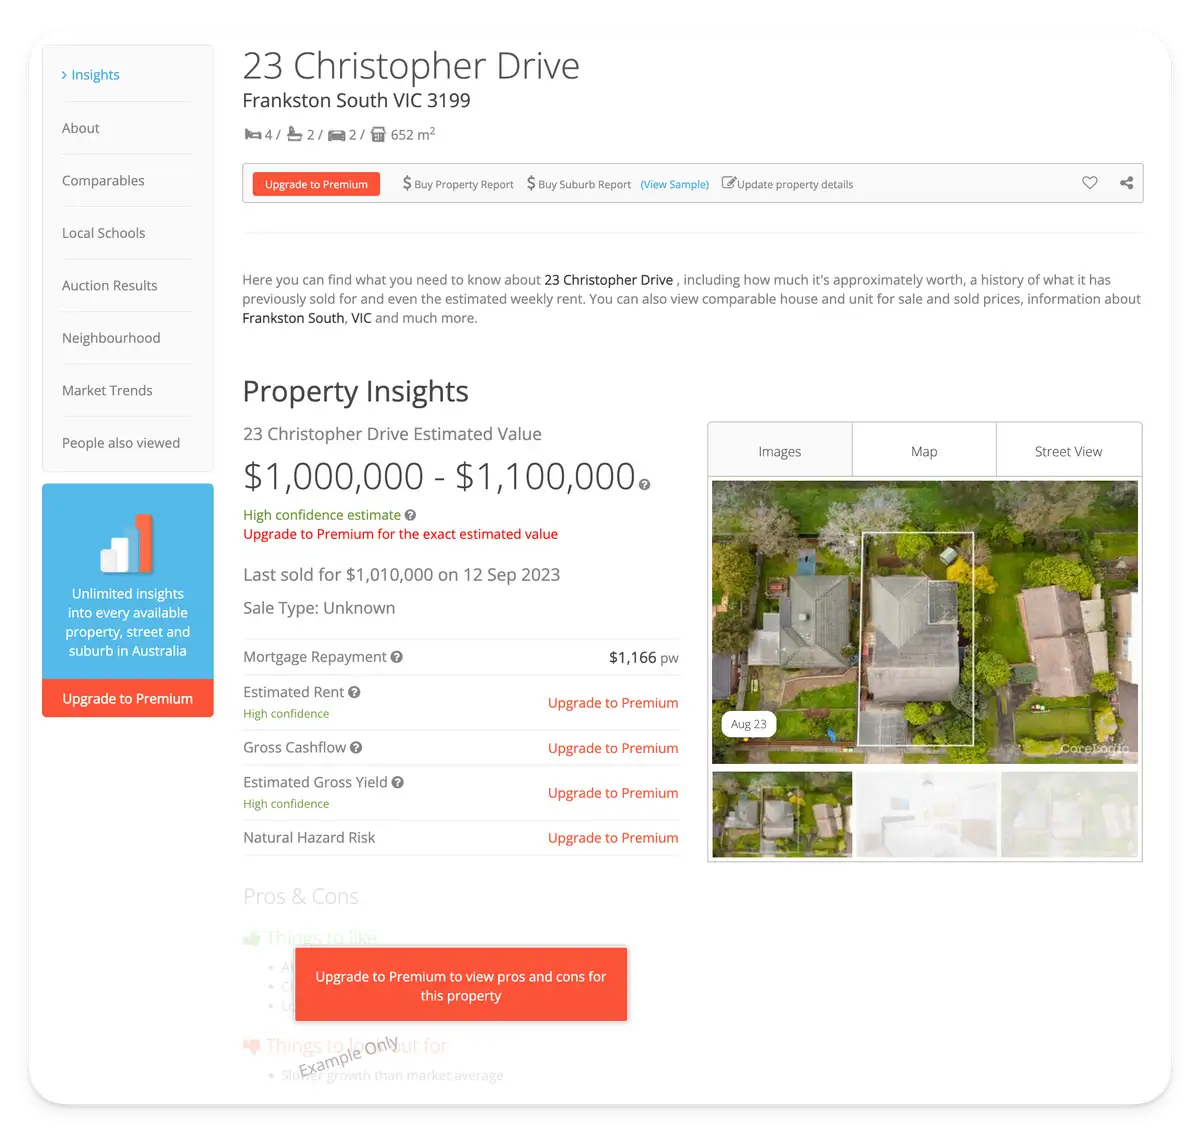
1. CoreLogic PropertyValue (Police Bank Edition)

Link: PropertyValue Police Bank free valuation tool

This tool is powered by CoreLogic and partnered with Police Bank, offering free access to a detailed valuation report. Simply enter your property address to receive:

  • Estimated market value
  • Price trends and comparable sales
  • Recent nearby sales and suburb insights

It’s perfect for owner-occupiers or investors wanting a CoreLogic-backed estimate without paying for a full report.

PropertyValue PoliceBank Screenshot


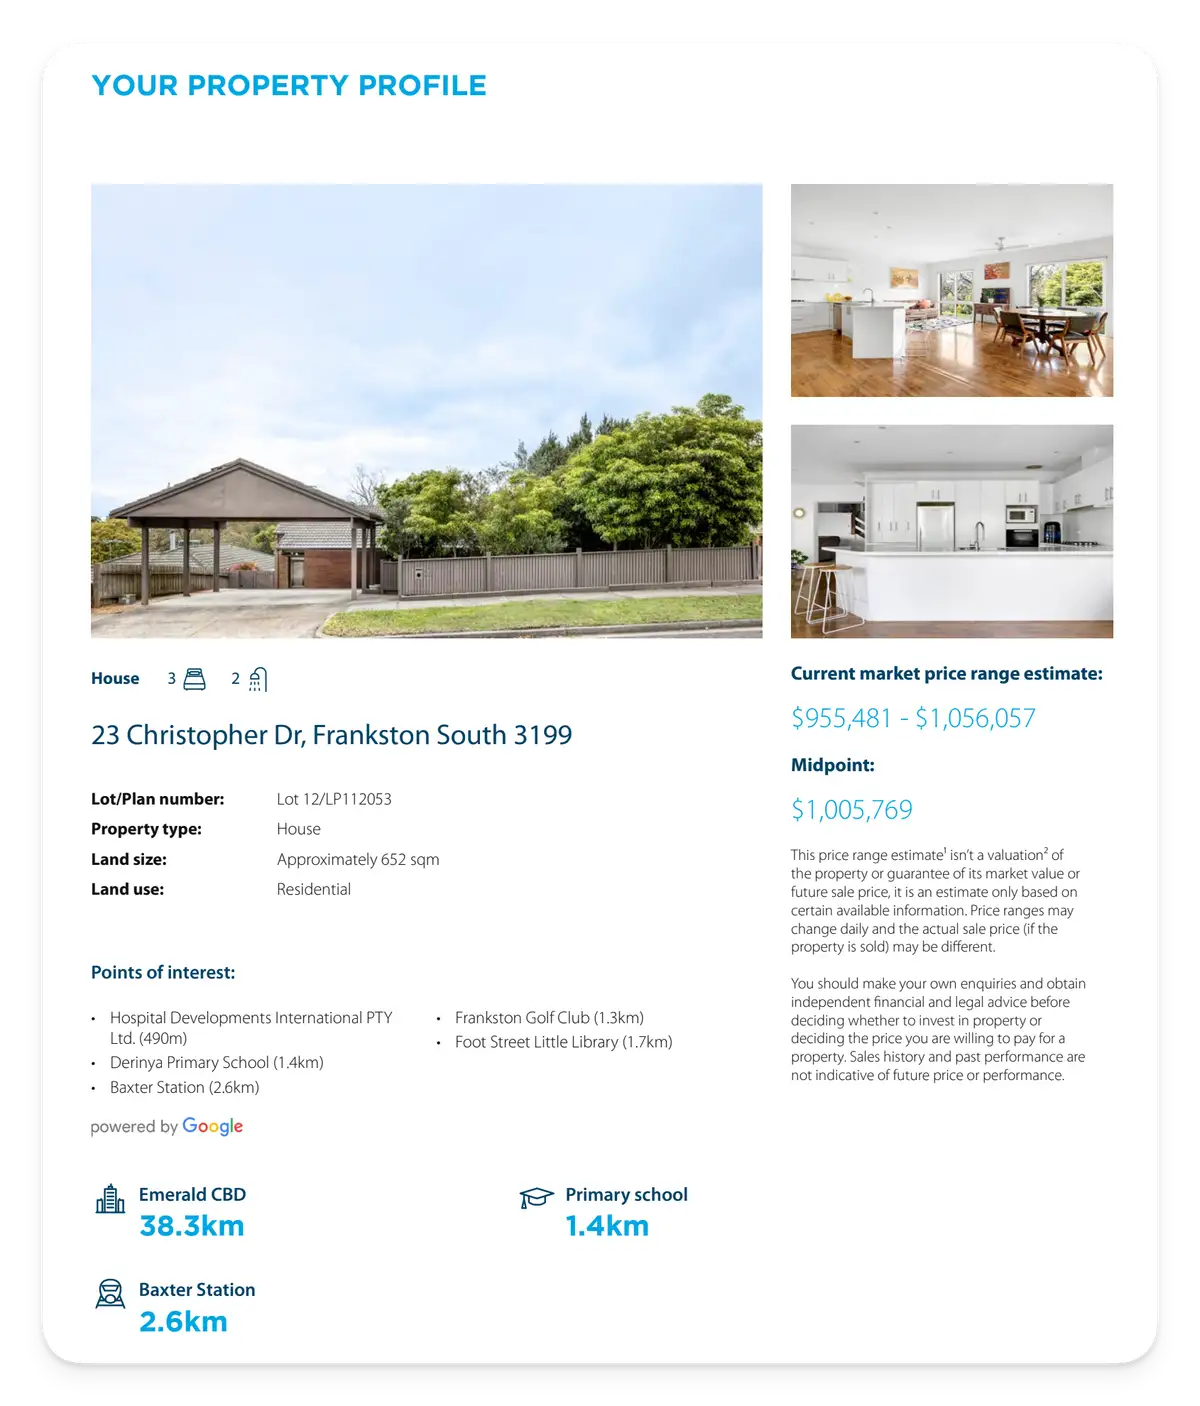
2. ANZ Property Profile Report

Link: ANZ Property Profile Report (CoreLogic)

ANZ’s free tool lets you download a comprehensive PDF property report powered by CoreLogic. You’ll receive:

  • Estimated property value
  • Property photos, last sale date, and land size
  • 12-month suburb price movement
  • Comparable sales analysis

Ideal for anyone researching a home loan or considering property investment.

ANZ Property Report Screenshot


3. BOQ Property Report by CoreLogic

Link: BOQ Property Report by CoreLogic

Bank of Queensland (BOQ) offers this sleek tool in partnership with CoreLogic. You’ll get a similar PDF report to the ANZ version, containing:

  • Property details and history
  • Suburb performance metrics
  • CoreLogic estimated market value
  • Local sales trends and statistics

It’s a fast, professional report—great for pre-approval or negotiation prep.

BOQ Property Report Screenshot


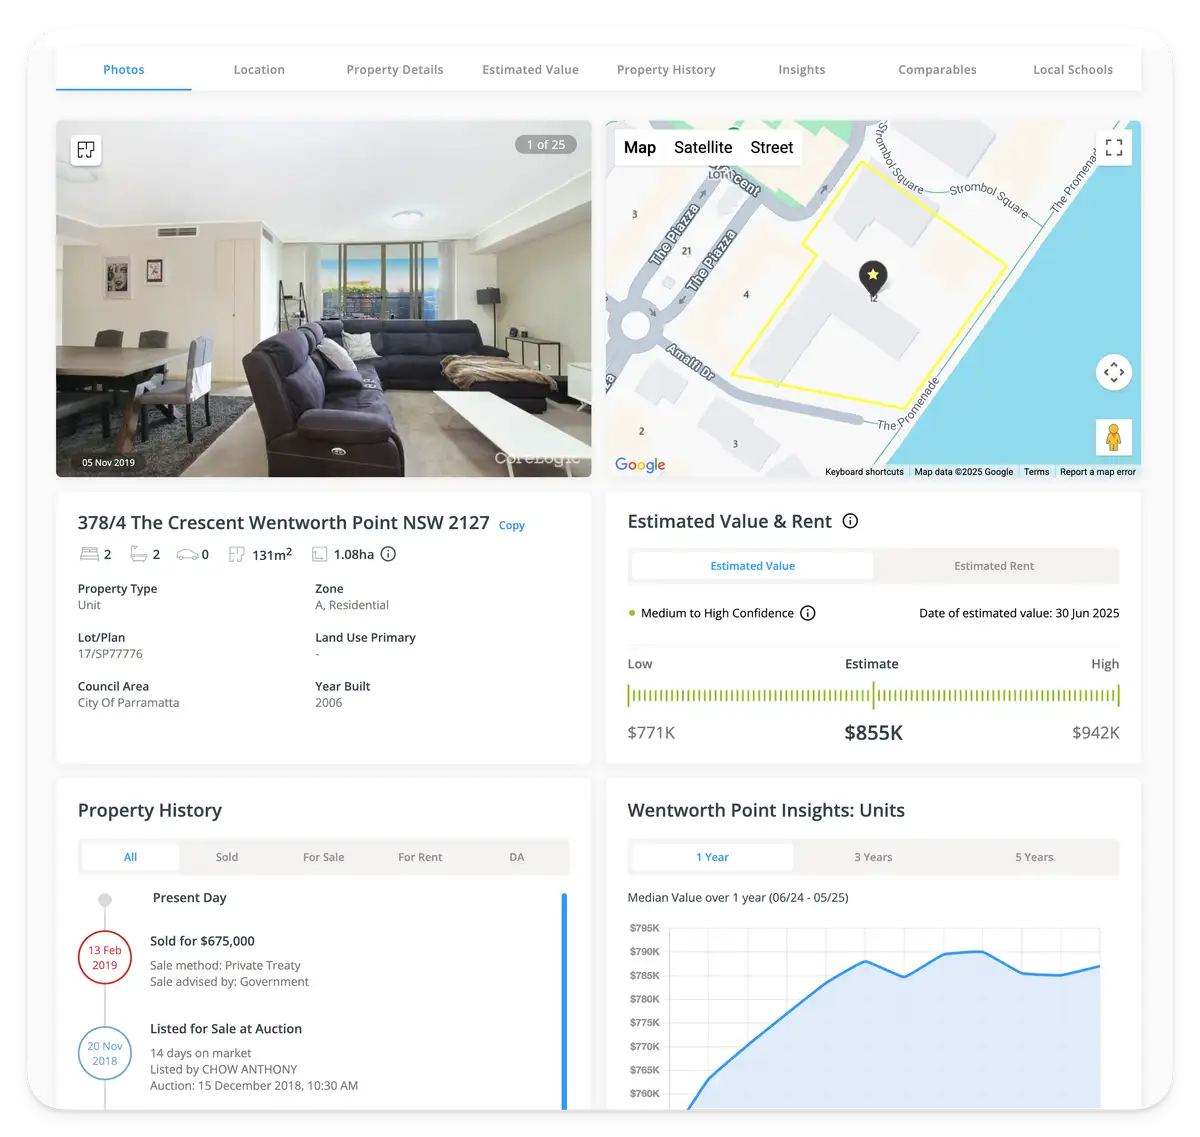
4. NAB Property Insights

Link: NAB Property Insights report

NAB offers an interactive web-based report (no download required). This tool is particularly strong for:

  • Real-time estimated value and confidence range
  • Property history and market comparison
  • Local area price trends and rental data

The platform also works great on mobile, offering a modern and intuitive experience.

NAB Property Insights Screenshot


5. Westpac Property Research Tool

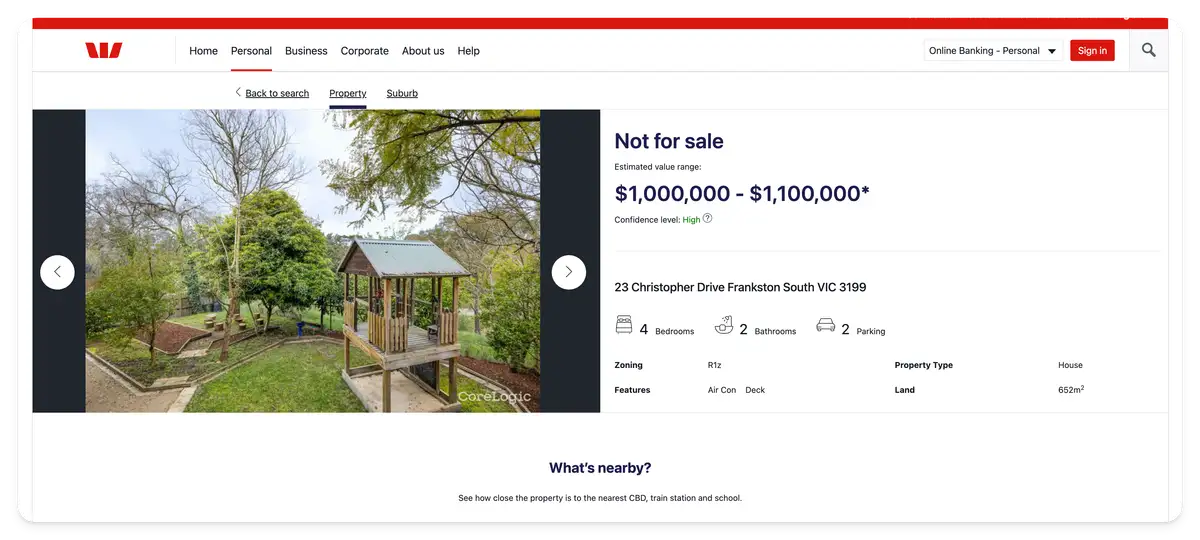
Link: Westpac Property Research Tool

Westpac’s tool gives users a summary property value, suburb insights, and price trend chart right from the browser. While it doesn’t offer a downloadable report, it’s useful for:

  • Quick value snapshot
  • Nearby sales browsing
  • Price movement trends

It’s one of the fastest ways to get a quick value check with no sign-up required.

Westpac Property Research Screenshot


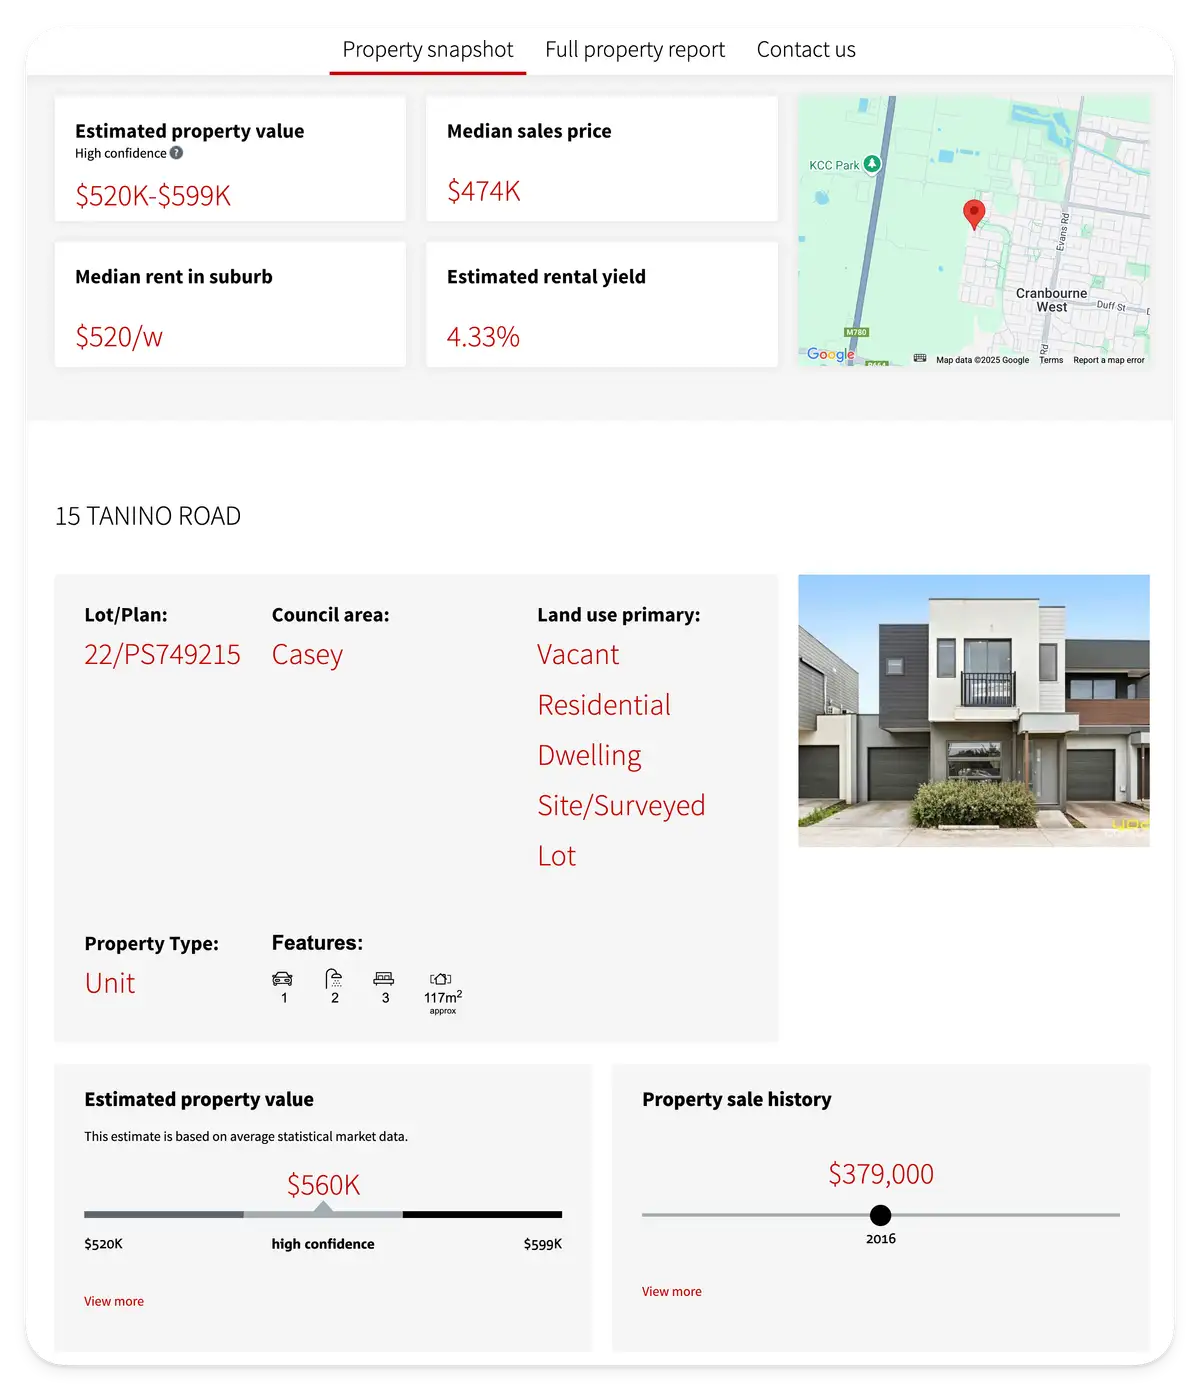
Bonus: Core PropertyValue.com.au (Direct)

Link: CoreLogic PropertyValue (direct)

This is the flagship CoreLogic property valuation site. It offers free basic searches and paid advanced reports. The basic lookup gives:

  • Market estimate and recent sales
  • Estimated rental range
  • Suburb-level insights

While advanced reports are behind a paywall, this is the most comprehensive source of CoreLogic data for Australian properties.

CoreLogic PropertyValue Screenshot


💡 Final Tip

Use multiple tools to compare estimates and get a more accurate view of your property’s market position. Even small variances can make a big difference when negotiating or refinancing.

Need a smarter way to track your portfolio performance? Try our free property investment calculator with equity tracking and capital growth forecasting built in.


PropMax.com.au — Smarter investment decisions start here.

Why use Propmax

Want to know the true numbers before you buy?

Start Now in 20 Seconds for Free

Model Property Cashflow, Holding Cost & ROI

Analyse Australian investment properties with 30-year projections across cashflow, holding costs, equity growth and after-tax returns.

  • Interactive 30-year investment property cashflow forecasts
  • Weekly, monthly and annual holding cost breakdowns
  • Track equity growth, rental income and loan balances over time
  • See real ROI after expenses, tax and financing costs
Model Property Cashflow, Holding Cost & ROI screenshot

Compare Ownership Structures & Tax Outcomes

See how personal, joint, trust and company ownership structures affect cashflow, deductions and long-term returns under current tax rules.

  • Compare personal, trust and company ownership scenarios
  • Model different income splits across owners
  • Visualise impact on deductions and after-tax cashflow
  • Find the structure with the strongest long-term ROI
Compare Ownership Structures & Tax Outcomes screenshot

Stress-Test Rates, Capital Growth & Tax Changes

Explore how changing interest rates, capital growth assumptions and tax settings affect your investment strategy.

  • Model interest rate rises and loan changes
  • Forecast different capital growth scenarios
  • Simulate CGT and policy changes on long-term returns
  • Test resilience before committing to a purchase
Stress-Test Rates, Capital Growth & Tax Changes screenshot

Estimate Depreciation, Deductions & Tax Benefits

Calculate depreciation, negative gearing and ownership-specific tax impacts using Australian property rules.

  • ATO-aligned building and fixture depreciation estimates
  • Estimate negative gearing and tax deductions
  • See impact on taxable income and net cashflow
  • Factor in property age, construction cost and low-value pools
Estimate Depreciation, Deductions & Tax Benefits screenshot

Latest blog posts

Deep Dives for Property Investors

Practical calculators, strategy breakdowns, and tax explainers from the PropMax team.

Latest suburb snapshots

Recent Suburb Cashflow & Holding Cost Reports

Explore Free Sample Cashflow & Holding Cost Reports

NSW
Leppington

New South Wales

Investment Property Cashflow and Holding Cost Report - Leppington, New South Wales

View report
NSW
Parramatta

New South Wales

Investment Property Cashflow and Holding Cost Report - Parramatta, New South Wales

View report
VIC
Cranbourne West

Victoria

Investment Property Cashflow and Holding Cost Report - Cranbourne West, Victoria

View report
VIC
Frankston

Victoria

Investment Property Cashflow and Holding Cost Report - Frankston, Victoria

View report
VIC
Frankston North

Victoria

Investment Property Cashflow and Holding Cost Report - Frankston North, Victoria

View report
VIC
Geelong

Victoria

Investment Property Cashflow and Holding Cost Report - Geelong, Victoria

View report
VIC
Heidelberg West

Victoria

Investment Property Cashflow and Holding Cost Report - Heidelberg West, Victoria

View report
VIC
Melton

Victoria

Investment Property Cashflow and Holding Cost Report - Melton, Victoria

View report
VIC
Mordialloc

Victoria

Investment Property Cashflow and Holding Cost Report - Mordialloc, Victoria

View report

Still curious?

Frequently Asked Questions

Answers to the most common investor questions about PropMax.

Yes. PropMax includes a free investment property cashflow calculator for Australian investors. Analyse rental income, holding costs, tax outcomes, equity growth and long-term returns with 30-year property projections.
PropMax lets you model 30-year investment property scenarios including rental cashflow, holding costs, loan repayments (IO and P&I), depreciation, equity growth, ROI, CAGR and capital gains outcomes. You can also stress-test rates, growth assumptions and tax changes.
Yes. PropMax lets you compare Personal, Trust, Company and SMSF ownership structures side-by-side. See how ownership affects cashflow, deductions, carried forward losses, tax outcomes and long-term investment performance.
Yes. PropMax can model post-budget tax scenarios including ownership structure impacts, carried forward losses and projected capital gains outcomes. Stress-test how changing tax rules may affect long-term cashflow and exit strategies.
Yes. PropMax includes a visual comparison tool where you can analyse up to three investment properties side-by-side. Compare cashflow, ROI, holding costs, capital growth and after-tax performance across multiple opportunities.
Yes. Export complete property analysis reports as Excel spreadsheets (CSV/XLSX) or polished PDF summaries. Reports include cashflow projections, equity growth, ownership structure comparisons, ROI and tax analysis.
Yes. PropMax estimates building and fixture depreciation, tax deductions, negative gearing effects and ownership-specific tax outcomes. See how deductions and depreciation influence taxable income and after-tax cashflow over time.
Track key portfolio metrics including LVR, DSR, NSR, equity growth, holding costs, cashflow, ROI, CAGR and long-term wealth creation indicators. PropMax helps identify serviceability, leverage and cashflow risks early.
PropMax is built for Australian property investors, buyer’s agents, mortgage brokers, accountants and financial advisers. Whether you're analysing your first investment property or managing a larger portfolio, PropMax helps compare scenarios and make better investment decisions.