LMI or Bigger Deposit? What’s Better When Buying an Investment Property in Australia
When building a property portfolio in Australia, one of the key decisions investors face is:
Should I pay Lenders Mortgage Insurance (LMI) and buy sooner with a smaller deposit, or wait and save more to avoid LMI altogether?
This decision can have a significant impact on your long-term return on investment, cash flow, and opportunity cost. In this guide, we’ll break down two detailed scenarios for the same property in Mordialloc, VIC — one purchased with LMI and a small deposit, and the other without LMI and a bigger deposit.
We compare the initial costs, annual holding costs, and return on investment (ROI) over 10 and 15 years. All projections are powered by PropMax.com.au.
The Investment Property
- Address: 3/17 Collocott Street, Mordialloc VIC 3195
- Property Type: 3-Bedroom Townhouse
- Purchase Price: $890,000
- Estimated Rent: $725/week, increasing by 2% annually
- Assumed Capital Growth: 5.4% annually
- Loan Structure: 30-year interest-only loan at 6.21%
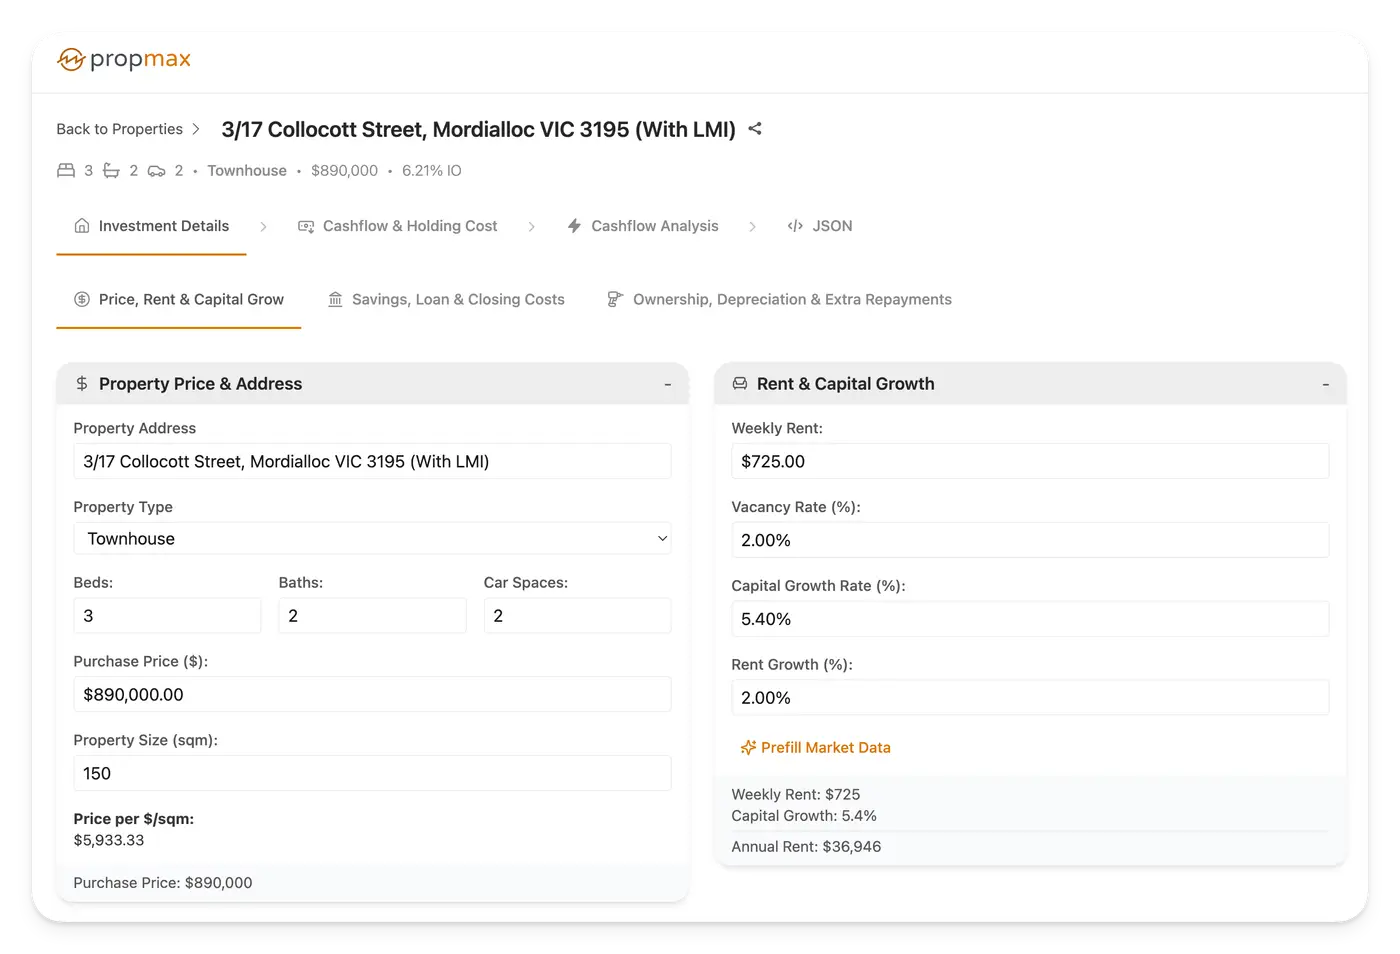
This townhouse is a typical investment-grade asset in a bayside Melbourne suburb, attractive to families and renters. Let’s explore how deposit strategy impacts performance.
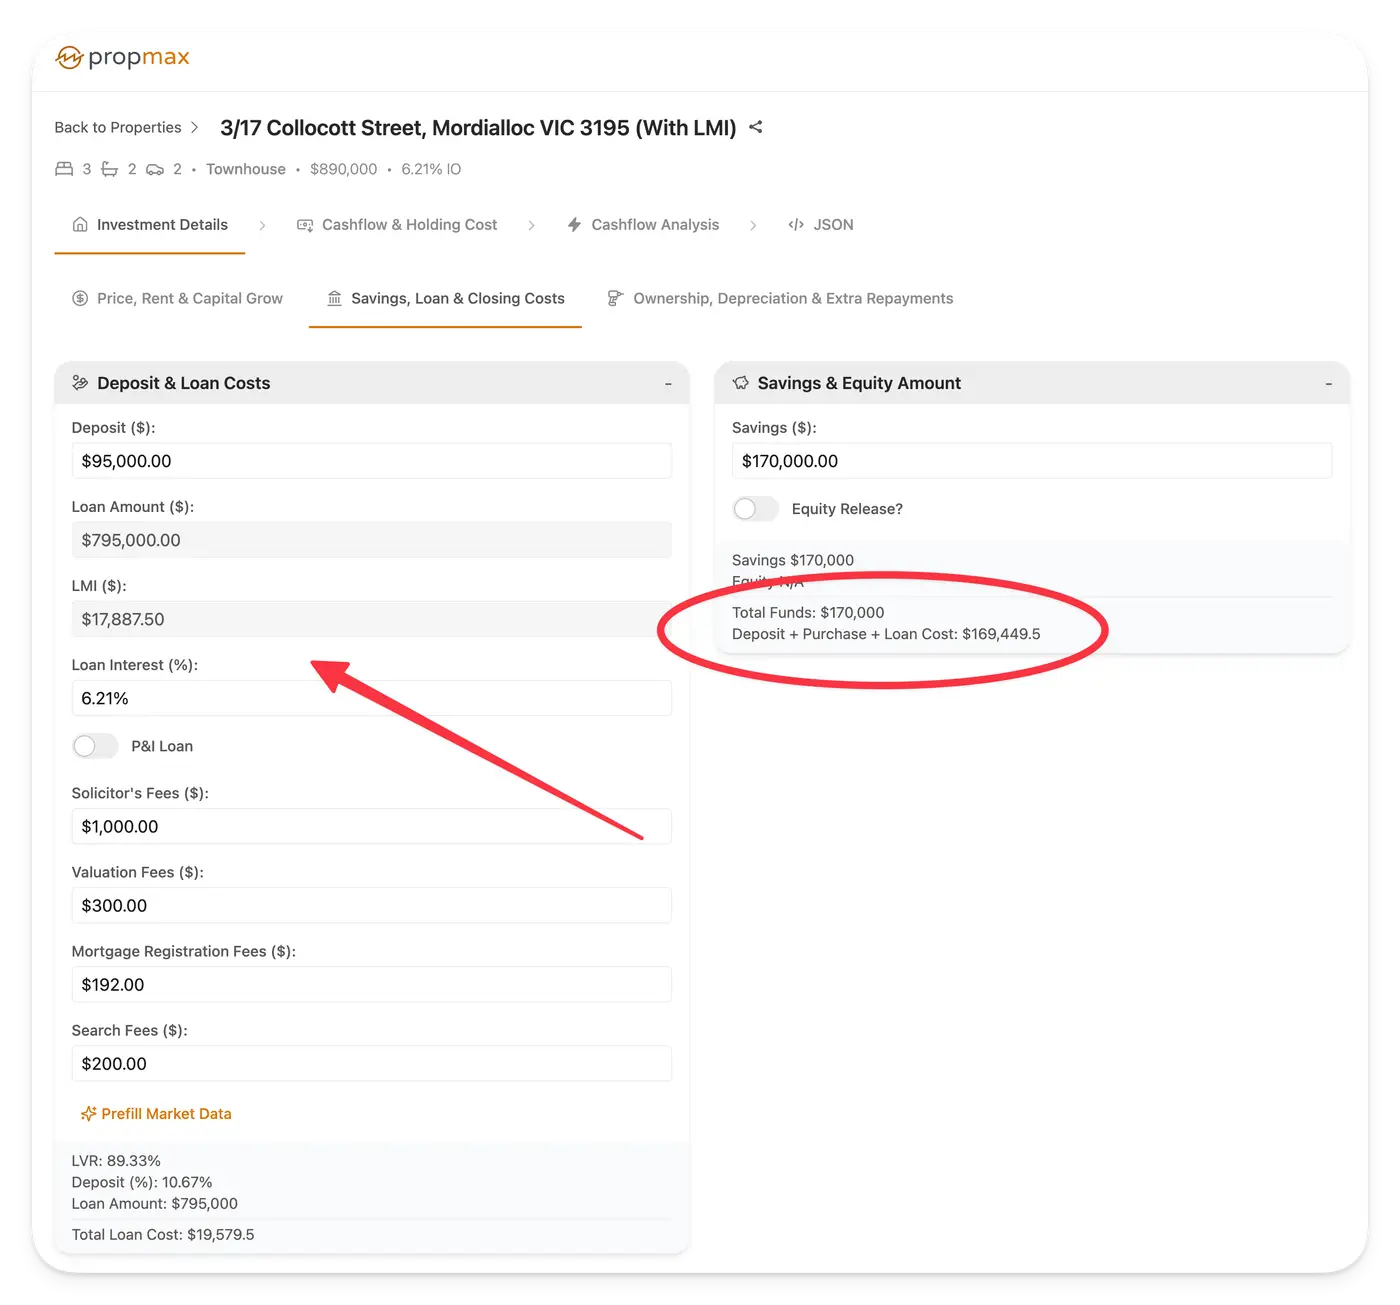
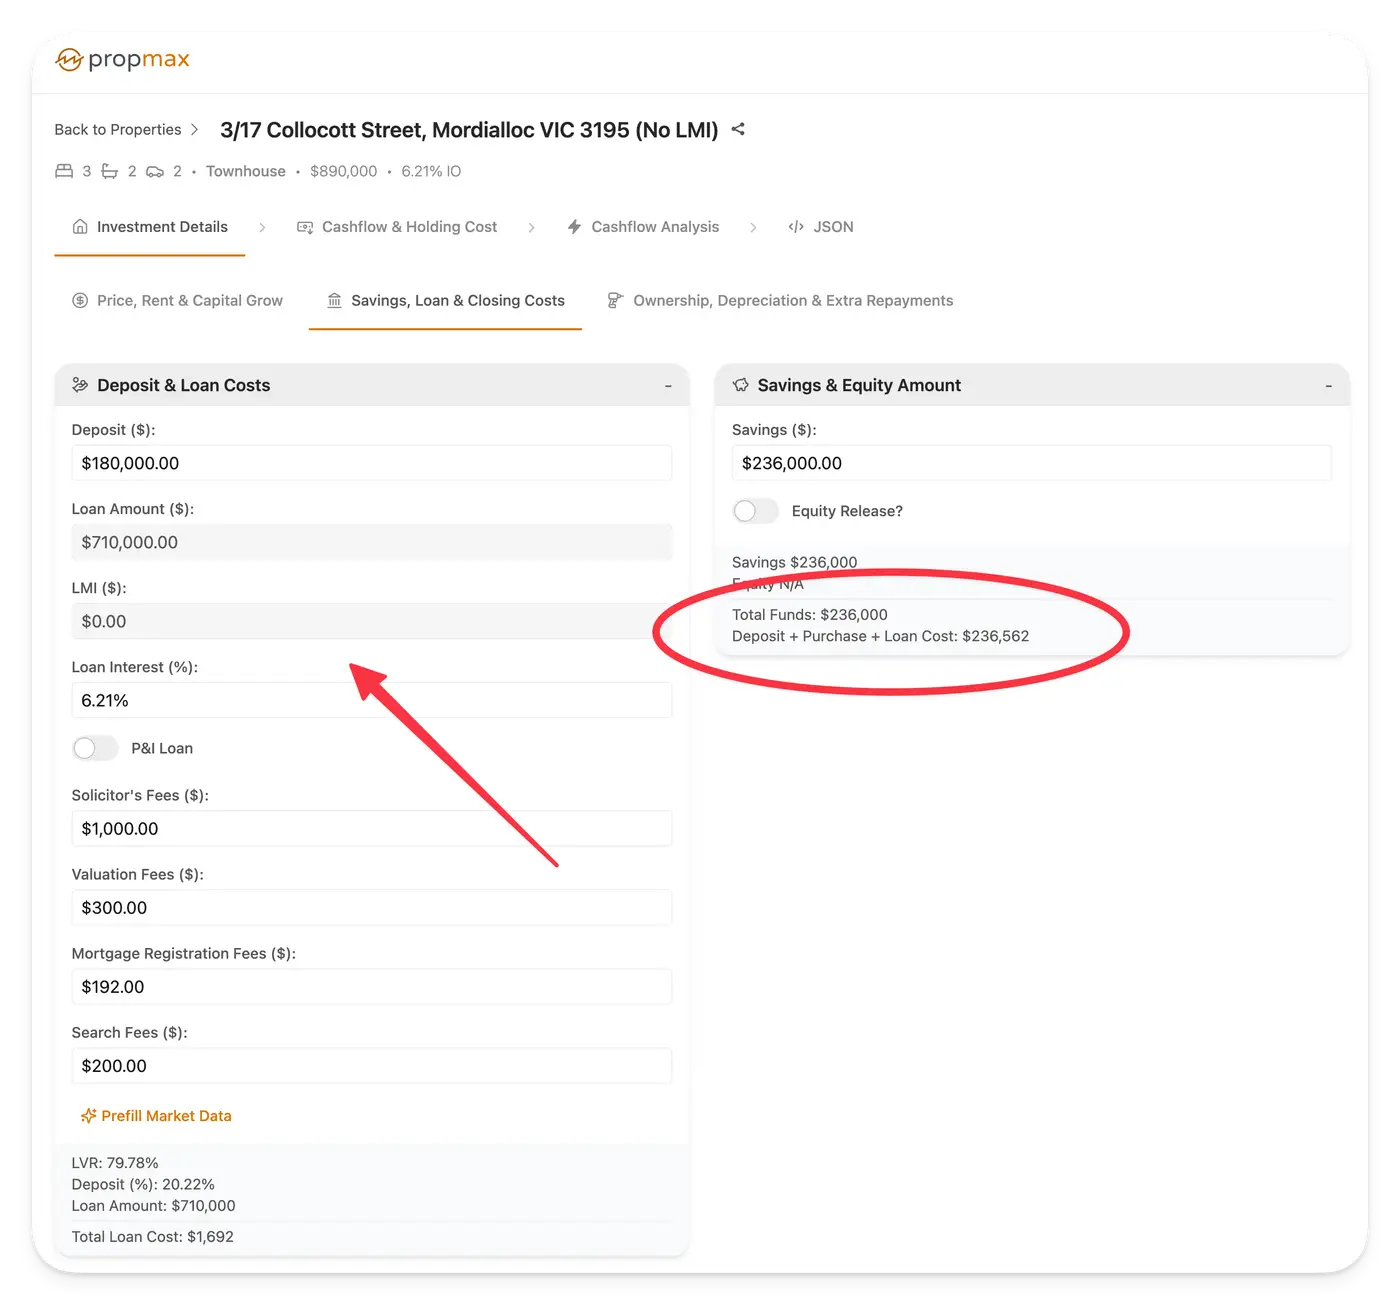
Scenario Comparison: With vs Without LMI
| With LMI | No LMI |
|---|
| Deposit | $95,000 | $180,000 |
| LMI Premium | $17,887.50 | $0 |
| Loan Amount | $795,000 | $710,000 |
| Stamp Duty + Closing Costs | $54,870 | $54,870 |
| Loan Setup Fees | $1,692 | $1,692 |
| Total Initial Cash | $169,450 | $236,562 |
💡 “Total Initial Cash” = Deposit + LMI + Loan Setup Fees + Stamp Duty & Closing Costs
Scenario details (With LMI):
Scenario details (No LMI):
Important Note: According to the Australian Taxation Office (ATO), LMI premiums are not immediately tax-deductible, but they can be claimed over five years as a borrowing cost. This means if you paid $17,887.50 in LMI upfront, you can deduct approximately $3,577.50 per year for five years against your rental income. Always consult a tax agent to apply this correctly.
Average Annual Holding Costs (Years 1–10)
| Category | With LMI | No LMI |
|---|
| Ownership Costs | $7,850 | $7,850 |
| Year 1 Interest | $49,369.50 | $44,091.00 |
| Avg Net Cashflow (after-tax) | -$4,500/year | -$1,100/year |
While the interest and holding costs are higher for the LMI scenario, these are partly offset by larger tax deductions (including LMI amortisation). You’ll also notice that despite tighter early cashflow, the LMI strategy unlocks earlier growth.
In PropMax.com.au cashflow projection ROI is calculated for each year, using the formula:
ROI = ((Cash on Hands After Equity Loan Payoff (if any) – Total Invested) / Total Invested) × 100
Where:
-
Cash After Equity Loan is the amount you would pocket if you sold the property at the end of that year, repaid the loan, paid CGT and selling costs, and repaid any released equity (if any).
-
Total Invested is the sum of:
- Your initial contribution (deposit + stamp duty + loan costs)
- Plus cumulative holding costs, which includes any shortfall between rental income and outgoings (like interest, maintenance, land tax, etc.).
What’s Included in the Model?
Our calculator accounts for:
- Capital growth based on annual appreciation
- Rental income growth
- Loan interest (IO or P&I)
- LMI and loan costs (spread over 5 years if deductible)
- Depreciation for tax offsets
- Ownership expenses like council rates, insurance, body corp, and PM fees
- Tax savings from negative gearing and depreciation
- Capital Gains Tax (CGT) with a 50% discount after 12 months (as per ATO rules)
Return on Investment (ROI) for LMI Scenarios
We’ve modelled the investment over time and measured net ROI after tax, cashflow, and selling costs using PropMax’s investment engine.
| Scenario | ROI After 10 Years | ROI After 15 Years |
|---|
| No LMI | 137.89% | 262.07% |
| With LMI | 140.13% | 263.48% |
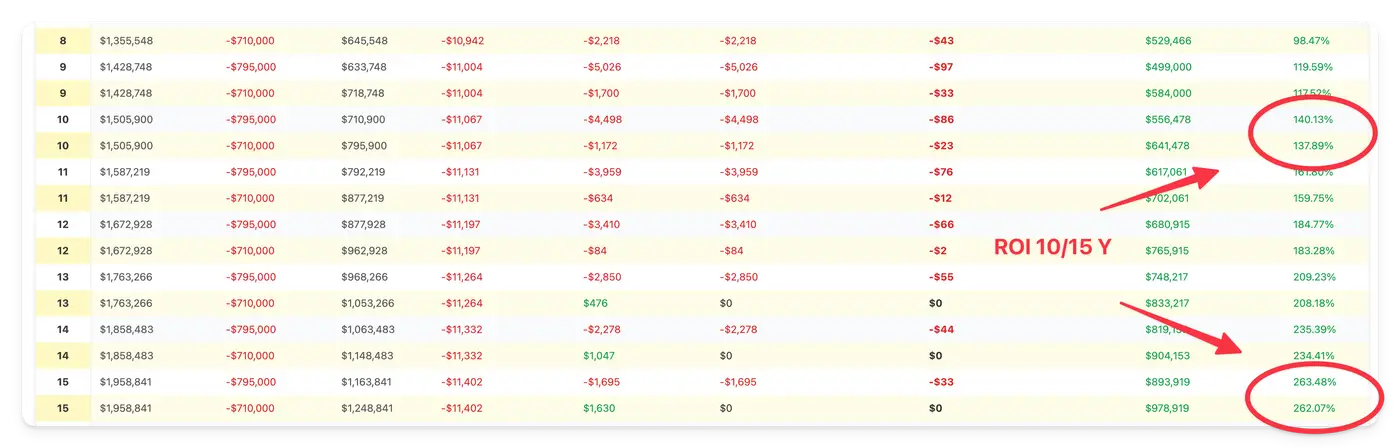
Both scenarios generate healthy returns, but using LMI to enter earlier edges slightly ahead due to compounding capital growth — even after accounting for the LMI cost and extra interest.
LMI vs Bigger Deposit: Pros and Cons Explained
When deciding between paying Lenders Mortgage Insurance (LMI) or saving for a larger deposit, the right choice depends on your financial goals, risk tolerance, and market timing. Below we compare the core benefits and drawbacks of both approaches.
✅ Benefits of Paying LMI (Smaller Deposit Strategy)
-
Enter the market sooner
By using LMI, you can buy a property with as little as a 10% deposit. This lets you start benefiting from capital growth earlier—especially important in rising markets.
-
Leverage property growth
Getting in sooner means you may capture more years of price appreciation. Leverage allows your smaller deposit to control a larger asset.
-
Tax-deductible borrowing cost
According to the ATO, LMI is treated as a borrowing expense. While not immediately deductible, it can typically be claimed over five years for investment properties, reducing your taxable income over that period.
❌ Drawbacks of Paying LMI
-
Higher interest repayments
Since you're borrowing more, you'll pay more interest over the life of the loan—potentially tens of thousands more.
-
Reduced early cashflow
A larger loan means higher repayments. Your rental income may not fully cover expenses, especially in the first few years.
-
Upfront LMI cost
While LMI can be capitalised into the loan and claimed over time, it still adds to your total borrowing and upfront costs.
✅ Benefits of Avoiding LMI (Larger Deposit Strategy)
-
Lower loan amount = lower interest
Saving a 20% deposit avoids LMI and reduces the size of your loan, leading to less interest paid over time and improved serviceability.
-
Better early cashflow
A smaller loan reduces repayments, making it easier to achieve a neutral or positive cashflow position from day one.
-
Lower financial risk
More equity upfront reduces your Loan-to-Value Ratio (LVR), giving you a stronger buffer against market fluctuations or vacancy periods.
❌ Drawbacks of Avoiding LMI
-
Delayed entry = lost growth
It might take years to save the additional deposit—during which time property prices may rise faster than your savings.
-
Lower capital efficiency
Putting more cash into a deposit can mean your money is working less efficiently compared to leveraging through LMI.
-
Opportunity cost
Funds tied up in the deposit could potentially be used for other investments or as a buffer for unforeseen costs.
So, Which Strategy Wins?
Choose LMI if:
- You're eager to enter the market and confident in growth
- You want to maximise leverage and ROI
- You're planning to scale your property portfolio
Choose No LMI if:
- You prefer financial safety and lower risk
- You already have enough capital saved
- You're focused on strong equity and long-term flexibility
Final Tip
Both strategies work — but they suit different profiles.
If you have a high income, strong borrowing capacity, and want to maximise growth, using LMI to get in early can lead to higher long-term ROI. On the other hand, avoiding LMI and borrowing conservatively offers stronger cashflow and lower risk.
Whichever route you choose, tools like PropMax.com.au can help model your cashflow, capital growth, tax impact, and ROI in detail.
PropMax.com.au — Smarter investment decisions start here.


